
The Cold Line
How it works
Research software. You build your own number for a game first, then compare it with the game line. The desks give you the research, the live context, and a record to review later. We do not sell picks. We do not take bets. We do not operate a sportsbook.
Football is the flagship. Every sport we cover has a desk. This page starts with one worked example, then walks the desks in the order you would use them — first the Builder, where you make your number, then the live desks, then the later checks.
Worked example
Illustrative exampleOne game, start to finish
Made-up numbers to show the steps. Not live data, not a pick, and not a result.
- Sport
- NFL
- Game
- Team A at Team B
- Kickoff
- Sunday 1:00 PM ET
- Data
- The kinds of inputs the Builder uses: weather, rest, travel, and injuries
- As of
- Not live. Illustrative numbers only
- Step 1You
Choose a game
Start with the game you want to study: NFL, Team A at Team B.
- Step 2The Cold Line
Review the information
The Builder lays out the inputs: wind blowing across the field, Team A on short rest, and Team B's left tackle listed as questionable.
- Step 3You
Build your number
Start from the data-driven dials, change what you believe, and the Builder turns it into your fair spread.
Your numberTeam A -2.8
- Step 4You
Reveal the game line
With your number set, now look at the sportsbook line for the same game. Building first keeps that line from anchoring your number.
Game lineTeam A -4.5
- Step 5The Cold Line
Compare
The Builder shows your number next to the game line, so the gap is easy to see.
Difference1.7 points
- Step 6You
Explain the difference
The book rates Team A 1.7 points stronger than you do. That is a disagreement to look into, not a guarantee, and your number is not automatically the more accurate one.
- Step 7You
Save it
Save the build with its inputs so you can reopen it later.
- Step 8You
Review later
After the game, look back at what you believed and why. Paper-test your reads over time without placing a bet.
Free account
01 · Your number
Cold Line Builder
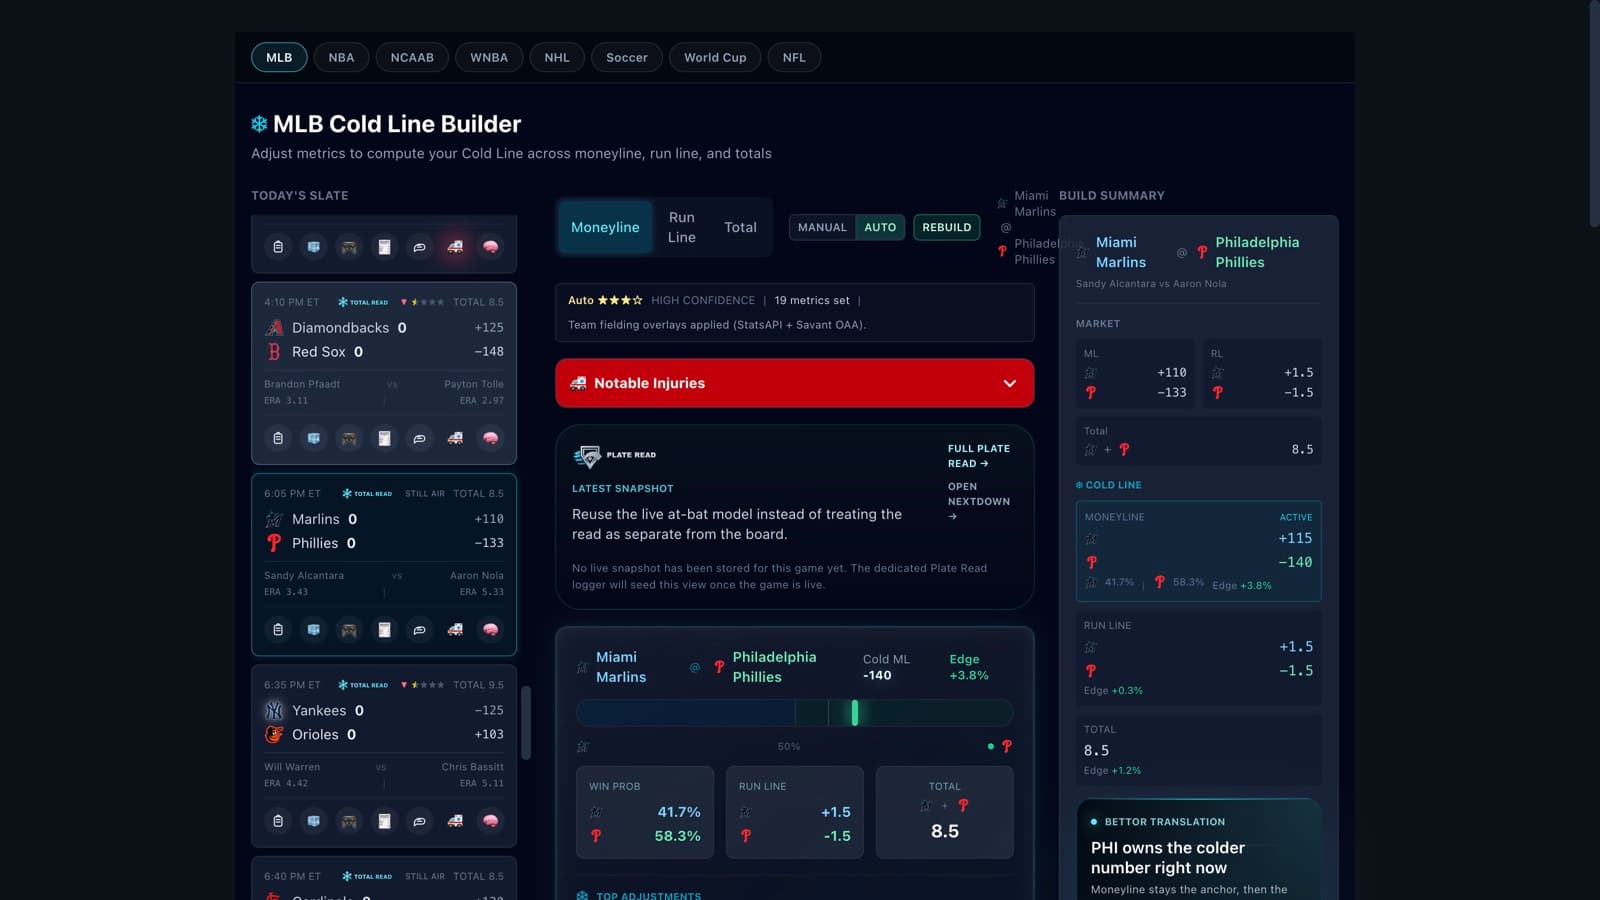
The workbench where you make your number. You open a real matchup and start from data-driven dials for the conditions already on the desk — weather, travel, rest, injuries, and the rest of the game state. Change what you believe, and the Builder turns it into your own fair spread, total, or moneyline.
What you look at: the slate on the left, the dials in the middle, and the build summary on the right. The summary shows your number beside the game line, market by market. If they disagree, you can see which of your inputs moved your number.
02 · Football flagship
NextDown NFL
The live football desk. Once the game is on, NextDown follows the next play — down, distance, and field position — not a recap of the score.
What you look at: the live possession outlook — who has the ball, field position, how the drive is likely to end, and whether the last few plays are heating up or cooling off.
Planning the season is separate. The unofficial Circa Survivor 2026 planner maps the 20-leg survivor pool, including the Thanksgiving leg and the Christmas leg.
03 · College football
NextDown College
The same live football desk for college. All Division I — FBS and FCS — not a short list of big-school games.
What you look at: the college slate in the same NextDown view. Pick a game and read the next play the same way you would on the NFL desk.
04 · Baseball
Plate Read
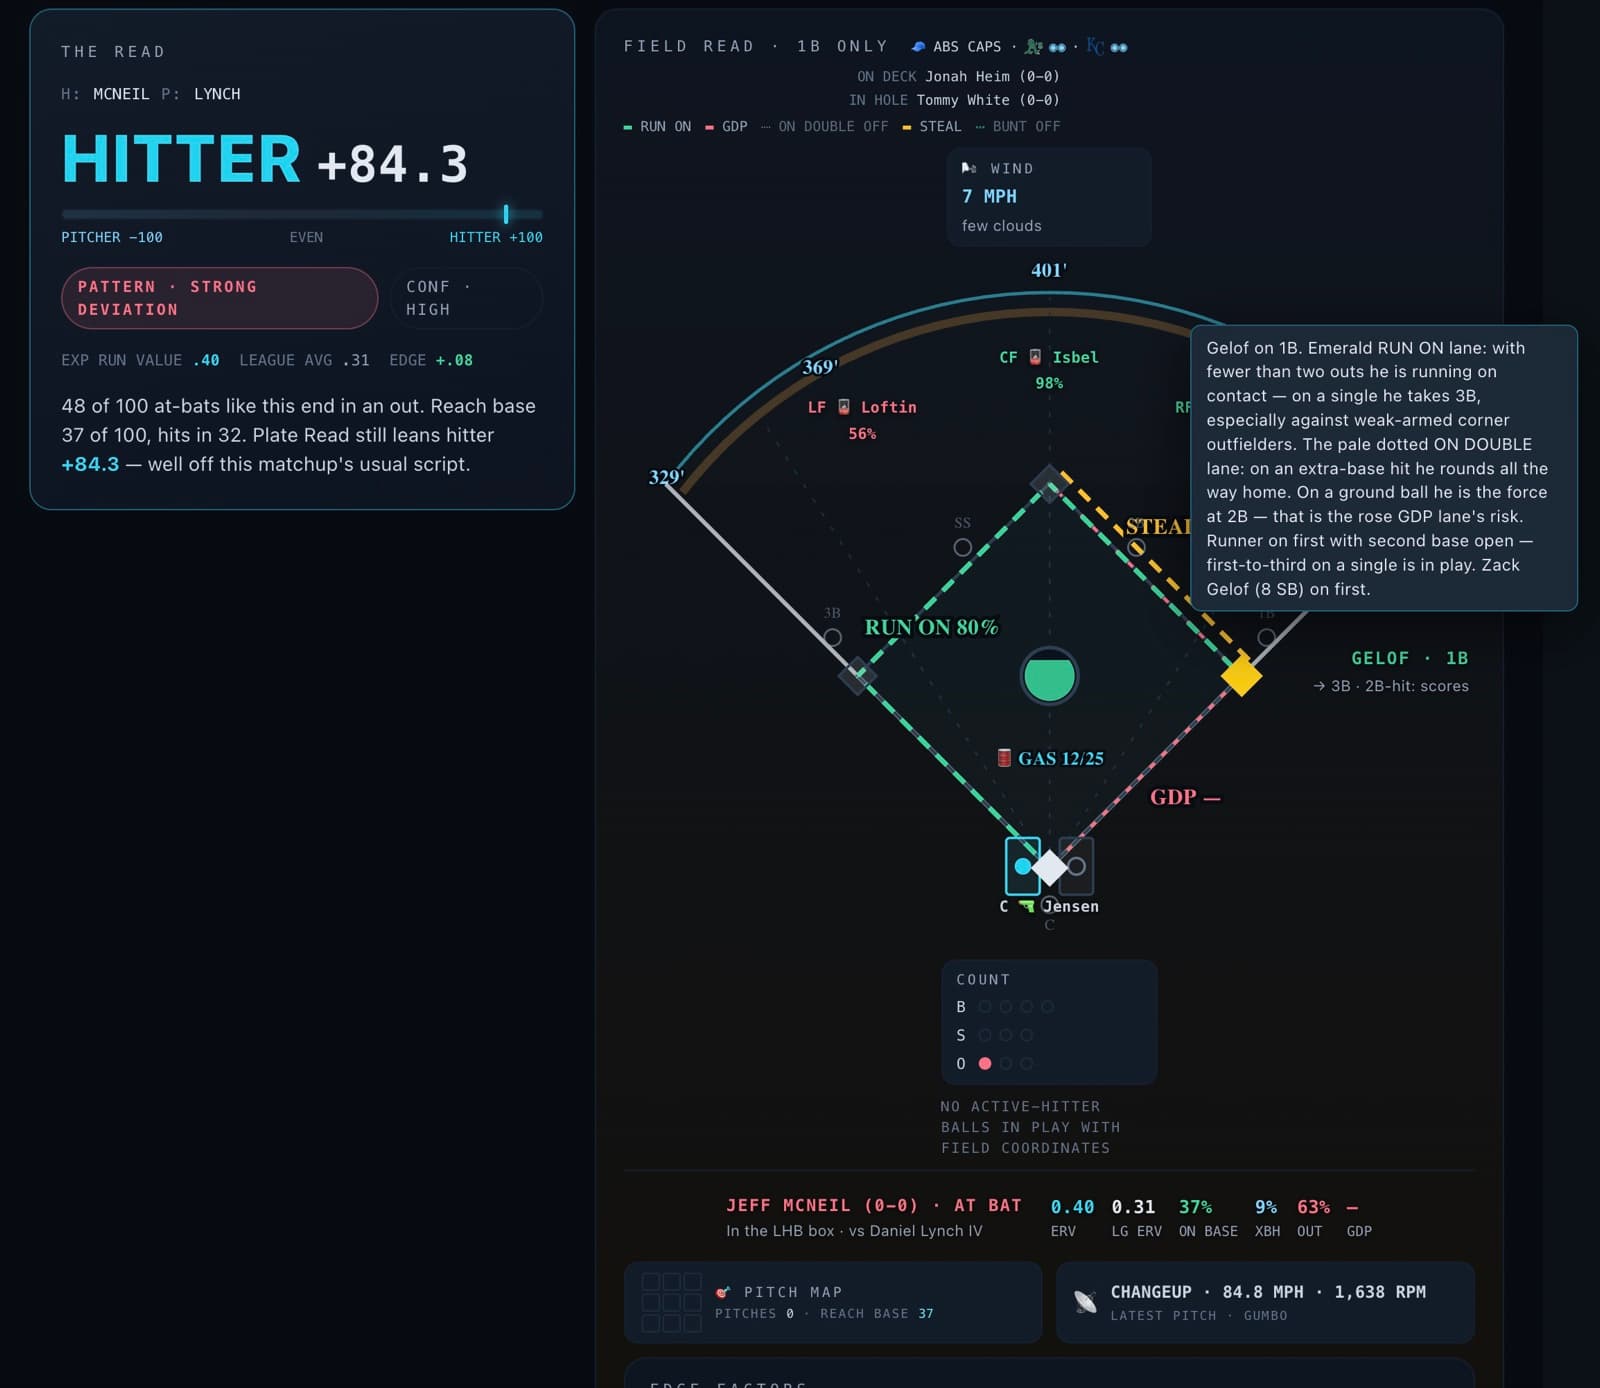
Baseball, pitch by pitch. Plate Read prices the state that exists now — the count, the runners, the park — not the number from first pitch.
What you look at: the diamond, the live at-bat, and the lanes that explain why a runner or a fielder is drawn that way. Hover anything on the field and the desk tells you what you are looking at.
05 · Soccer
Pitch Read
Soccer, while the match is on. Pitch Read follows the next goal, how the match is tilting, and the number for the rest of the game.
What you look at: the live match desk — the pitch, the clock, and the read that updates as the game state changes.
06 · Hockey
Puck Read
Hockey, shift by shift. Puck Read follows live win chance and game state as the period moves.
What you look at: the live hockey desk — the score, the period, and the read for the next shift.
07 · Basketball
Court Read
Basketball — NBA and college. Court Read is the live possession desk: who has the ball, the score, and the next trip down the floor.
What you look at: the live basketball slate and the selected game. NBA and college each have their own board on the same family of desks.
08 · Separate check
Edge Scanner
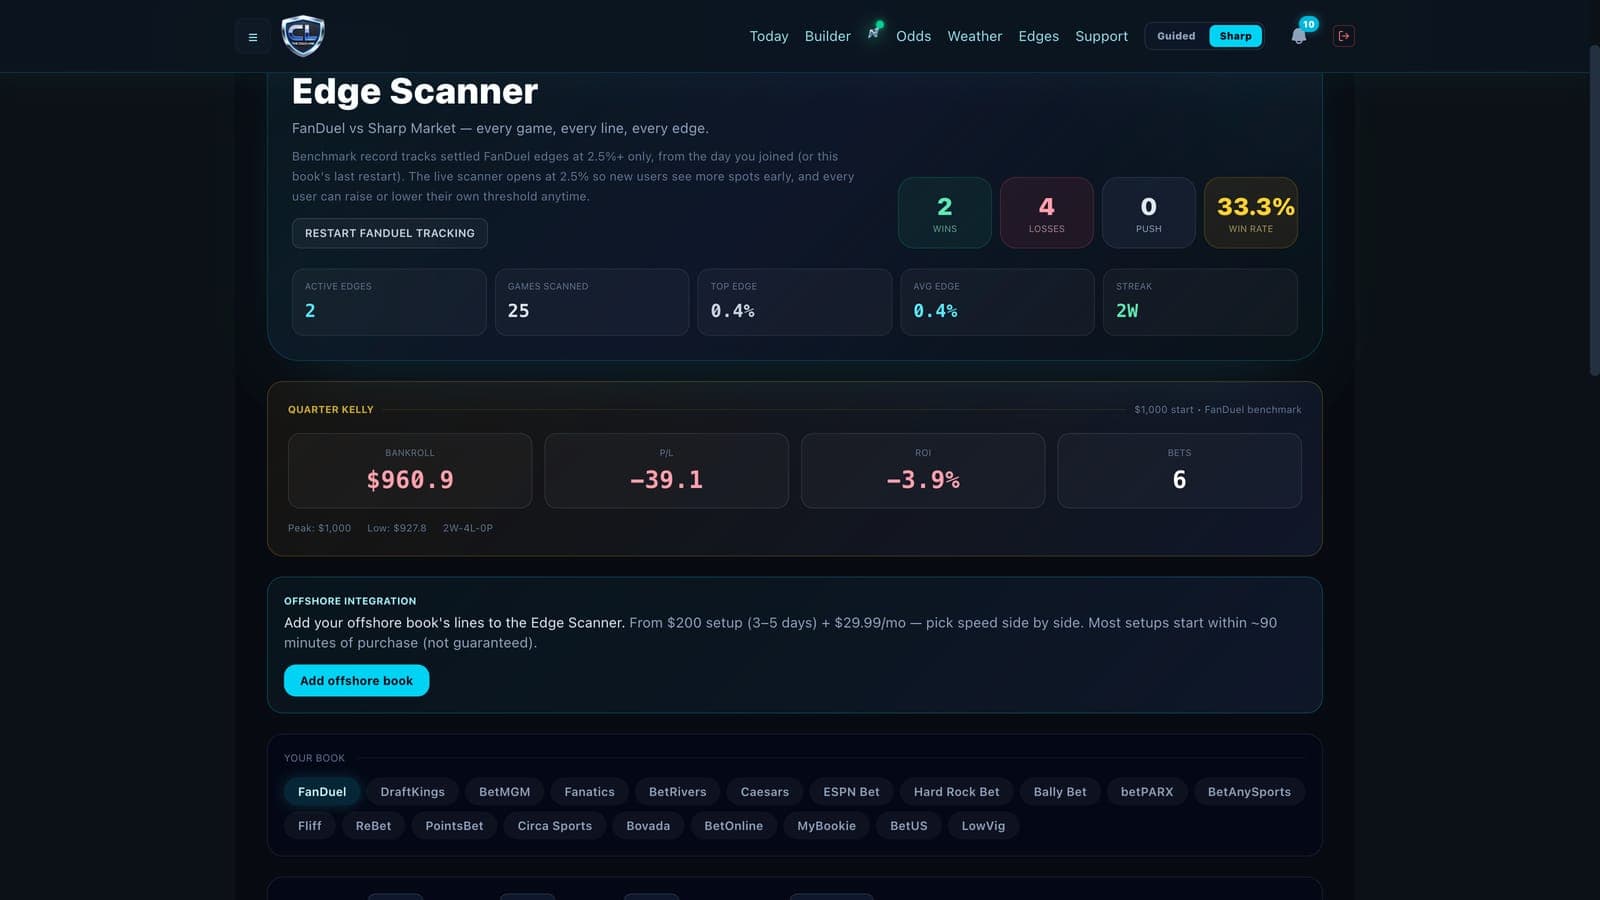
A separate check against the sharp market. Edge Scanner compares the moneyline, spread, and total at the sportsbook you choose with a sharp reference price across the slate. The reference comes from the market, not from anything you enter.
What you look at: one row per game and market, with the difference between the two prices. A difference is something to look into, not a guarantee. You set the bar for what is large enough to surface.
09 · Conditions
Weather
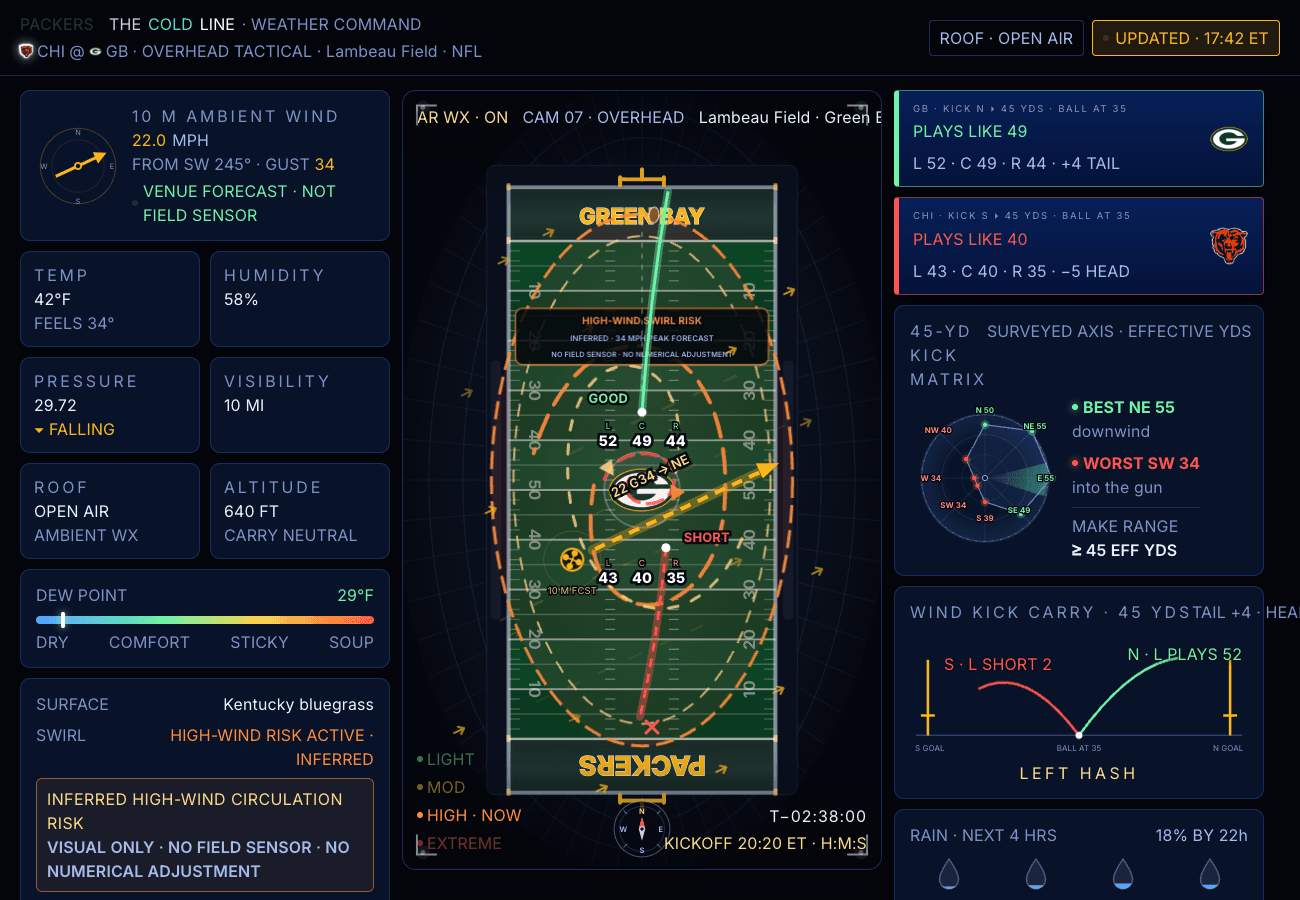
Park and stadium conditions that can matter to a total: wind, rain, heat, and whether the roof is open or closed.
What you look at: one card per game. Outdoor parks show the field, the wind, and how far a fly ball is likely to carry. Indoor and closed-roof buildings stay labeled as indoor — they are not treated as outdoor wind.
10 · The record
Audits
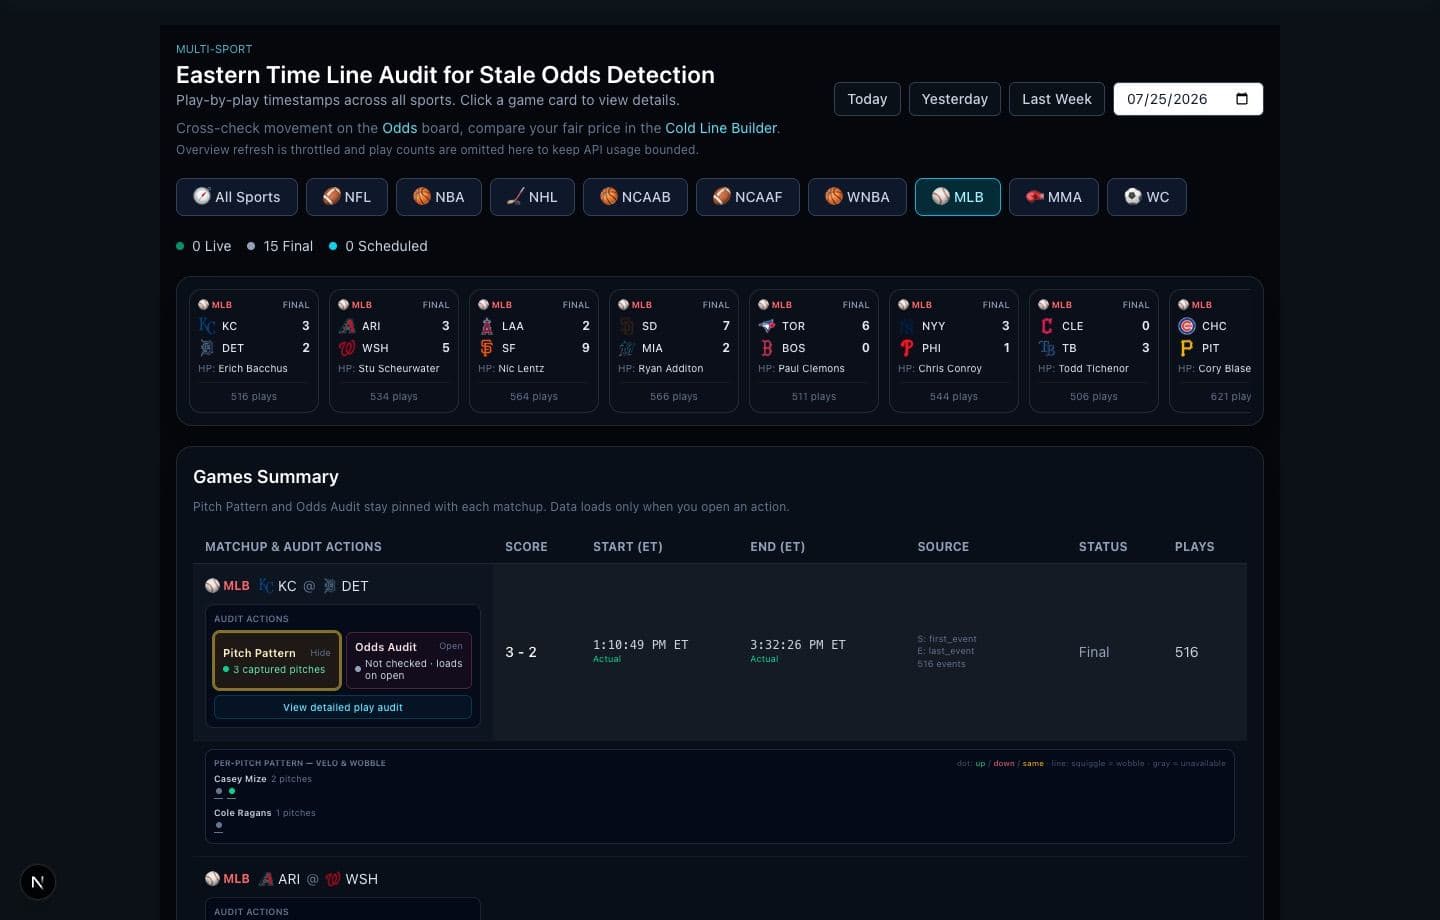
The record. Audits logs every tracked sportsbook line move with a timestamp and shows it beside the play-by-play, on one Eastern Time clock, so you can review what happened around each move. It records timing; it does not explain a move.
What you look at: the game cards, then the dual rail — play-by-play on one side, price moves on the other, both in Eastern Time. If a verified price capture is unavailable, the market rail says so.
That is the desk
Your number first. Then the live reads. Then the later checks. Research software only — we do not sell picks, take bets, or operate a sportsbook.